It would be fun to use the Otamatone in a musical piece. But for someone used to keyboard instruments it's not so easy to play cleanly. It has a touch-sensitive (resistive) slider that spans roughly two octaves in just 14 centimeters, which makes it very sensitive to finger placement. And in any case, I'd just like to have a programmable virtual instrument that sounds like the Otamatone.
What options do we have, as hackers? Of course the slider could be replaced with a MIDI interface, so that we could use a piano keyboard to hit the correct frequencies. But what if we could synthesize a similar sound all in software?
Sampling via microphone
We'll have to take a look at the waveform first. The Otamatone has a piercing electronic-sounding tone to it. One is inclined to think the waveform is something quite simple, perhaps a sawtooth wave with some harmonic coloring. Such a primitive signal would be easy to synthesize.
A friend lended me her Otamatone for recording purposes. Turns out the wave is nothing that simple. It's not a sawtooth wave, nor a square wave, no matter how the microphone is placed. But it sounds like one! Why could that be?
I suspect this is because the combination of speaker and air interface filters out the lowest harmonics (and parts of the others as well) of square waves. But the human ear still recognizes the residual features of a more primitive kind of waveform.
We have to get to the source!
Sampling the input voltage to the Otamatone's speaker could reveal the original signal. Also, by recording both the speaker input and the audio recorded via microphone, we could perhaps devise a software filter to simulate the speaker and head resonance. Then our synthesizer would simplify into a simple generator and filter. But this would require opening up the instrument and soldering a couple of leads in, to make a Line Out connector. I'm not doing this to my friend's Otamatone, so I bought one of my own. I named it TÄMÄ.
I soldered the left channel and ground to the same pads the speaker is connected to. I had no idea about the voltage range in advance, but fortunately it just happens to fit line level and not destroy my sound card. As you can see in the background, we've recorded a signal that seems to be a square wave with a low duty cycle.
This square wave seems to be superimposed with a much quieter sinusoidal "ring" at 584 Hz that gradually fades out in 30 milliseconds.
Next we need to map out the effect the finger position on the slider has on this signal. It seems to not only change the frequency but the duty cycle as well. This happens a bit differently depending on which one of the three octave settings (LO, MID, or HI) is selected.
The Otamatone has a huge musical range of over 6 octaves:
![[Image: Musical notation showing a range from A1 to B7.]](https://blogger.googleusercontent.com/img/b/R29vZ2xl/AVvXsEgV30yNuAN8hCumOCKRSM6a1eySsZbX25hZMl-irAbnntWoNPyfCxa1mB1RrRYp4ekcFdxgKsDBmTV4n1k1bOxE5RP3yMlJQNuerZxHXdZ22VBA_wsWzEMfEoKeBcDv5EWW77ZDqTlDn7BM/s400/otamatone-range.png)
In frequency terms this means roughly 55 to 3800 Hz.
The duty cycle changes according to where we are on the slider: from 33 % in the lowest notes to 5 % in the highest ones, on every octave setting. The frequency of the ring doesn't change, it's always at around 580 Hz, but it doesn't seem to appear at all on the HI setting.
So I had my Perl-based software synth generate a square wave whose duty cycle and frequency change according to given MIDI notes.
FIR filter 1: not so good
Raw audio generated this way doesn't sound right; it needs to be filtered to simulate the effects of the little speaker and other parts.
Ideally, I'd like to simulate the speaker and head resonances as an impulse response, by feeding well-known impulses into the speaker. The generated square wave could then be convolved with this response. But I thought a simpler way would be to create a custom FIR frequency response in REAPER, by visually comparing the speaker input and microphone capture spectra. When their spectra are laid on top of each other, we can read the required frequency response as the difference between harmonic powers, using the cursor in baudline. No problem, it's just 70 harmonics until we're outside hearing range!
I then subtracted one spectrum from another and manually created a ReaFir filter based on the extrema of the resulting graph.
Because the Otamatone's mouth can be twisted to make slightly different vowels I recorded two spectra, one with the mouth fully closed and the other one as open as possible.
But this method didn't quite give the sound the piercing nasalness I was hoping for.
FIR filter 2: better
After all that work I realized the line connection works in both directions! I can just feed any signal and the Otamatone will sound it via the speaker. So I generated a square wave in Audacity, set its frequency to 35 Hz to accommodate 30 milliseconds of response, played it via one sound card and recorded via another one:
The waveform below is called the step response. One of the repetitions can readily be used as a FIR convolution kernel. Strictly, to get an impulse response would require us to sound a unit impulse, i.e. just a single sample at maximum amplitude, not a square wave. But I'm not redoing that since recording this was hard enough already. For instance, I had to turn off the fridge to minimize background noise. I forgot to turn it back on, and now I have a box of melted ice cream and a freezer that smells like salmon. The step response gives pretty good results.
One of my favorite audio tools, sox, can do FFT convolution with an impulse response. You'll have to save the impulse response as a whitespace-separated list of plaintext sample values, and then run sox original.wav convolved.wav fir response.csv.
Or one could use a VST plugin like FogConvolver:
A little organic touch
There's more to an instrument's sound than its frequency spectrum. The way the note begins and ends, the so-called attack and release, are very important cues for the listener.
The width of a player's finger on the Otamatone causes the pressure to be distributed unevenly at first, resulting in a slight glide in frequency. This also happens at note-off. The exact amount of Hertz to glide depends on the octave, and by experimentation I stuck with a slide-up of 5 % of the target frequency in 0.1 seconds.
It is also very difficult to hit the correct note, so we could add some kind of random tuning error. But turns out this is would be too much; I want the music to at least be in tune.
Glides (glissando) are possible with the virtual instrument by playing a note before releasing the previous one. This glissando also happens in 100 milliseconds. I think it sounds pretty good when used in moderation.
I read somewhere (Wikipedia?) that vibrato is also possible with Otamatone. I didn't write a vibratio feature in the code itself, but it can be added using a VST plugin in REAPER (I use MVibrato from MAudioPlugins). I also added a slight flanger with inter-channel phase difference in the sample below, to make the sound just a little bit easier on the ears (but not too much).
Sometimes the Otamatone makes a short popping sound, perhaps when finger pressure is not firm enough. I added a few of these randomly after note-off.
Working with MIDI
We're getting on a side track, but anyway. Working with MIDI used to be straightforward on the Mac. But GarageBand, the tool I currently use to write music, amazingly doesn't have a MIDI export function. However, you can "File -> Add Region To Loop Library", then find the AIFF file in the loop library folder, and use a tool called GB2MIDI to extract MIDI data from it.
I used mididump from python-midi to read MIDI files.
Tyna Wind - lucid future vector
Here's TÄMÄ's beautiful synthesized voice singing us a song.
![[Image: A pink Otamatone in front of a microphone. Next to it a screenshot of Audacity with a periodic but complex waveform in it.]](https://blogger.googleusercontent.com/img/b/R29vZ2xl/AVvXsEheF9HQ5A_3NXK-RZkItzL19UQsYH19clTdD9zIwcqeYbYWLDmuYtQcu08wrquO59vbbdyedkzN7Tx_ZEdHp9Rw2s8b-VlmZNVvOFn6OBEctWfa1qXjbj0qKJpcyWbZNv5eW_JdosnzZ-jA/s500/popfilter.jpg)
![[Image: A Black Otamatone with a cable coming out of its mouth into a USB sound card. A waveform with more binary nature is displayed on a screen.]](https://blogger.googleusercontent.com/img/b/R29vZ2xl/AVvXsEha-l4G4z3zvNaB_4UpCaVp3G-JkeZgIYI_7q0dfXYQwygBWYMBfXmQsDt1Qvpw0hkwMNTXLjaJE2xz9U7dv-S1yTNSVL8TSH9PhVSNMhZlCCN0QH4aeilTxxOl96IHU22LsseUR7nJ0Yad/s420/otamalineout.jpg)
![[Image: Oscillogram of a square wave.]](https://blogger.googleusercontent.com/img/b/R29vZ2xl/AVvXsEjpR7HiGi6gtLxjIOXF1q109KtIkKXlX7cN7OAuUa27KLATtKaz0qJ0PxVN3lt3Uf7WvUWo2I3SMpPUV056zLbiDCDhlupMJot1bjHwxWs40sc7jc-x32deNcM0VZariy8N1lW6pb4AK5kk/s450/Screen+Shot+2017-11-24+at+17.24.36.png)
![[Image: Screenshot of Baudline showing lots of frequency spikes, and next to it a CSV list of dozens of frequencies and power readings in the Vim editor.]](https://blogger.googleusercontent.com/img/b/R29vZ2xl/AVvXsEjtmPUtBeb_Dr02WSuLA8rcxRlnvZa5aOl2ajaE2kD8i4DtsKFPihJbEkH4f3rpfEsDldTuqv_bqfHEqgyX8yi_xTANmuzXneUIKPYn6EgLJiIXqzeN2RiV5WdgzNMtQsHeXxzuz1rGu2Qz/s480/harmopowers.png)
![[Image: Screenshot of REAPER's FIR filter editor, showing a frequency response made out of nodes and lines interpolated between them.]](https://blogger.googleusercontent.com/img/b/R29vZ2xl/AVvXsEinekeR8qdGsDJ5sWXxH_9G9jPzvQonFuC2tCSUu5GFzDFCfUW2T93QEIAYoTQ9gWDq-ps4YT6tw_0cK8ePiRheRynLOTBQ511rDIt62Zh5Jt2AJKW0wxbcw168nQqNWTkZzvRoPdAOYbku/s480/Screen+Shot+2017-11-19+at+10.21.26.png)
![[Image: Two waveforms, the top one of which is a square wave and the bottom one has a slowly decaying signal starting at every square transition.]](https://blogger.googleusercontent.com/img/b/R29vZ2xl/AVvXsEjYJqCo1whmphJf0z81cYQFYl1fEZUGrMwVWOX0Hj9tmWNOEvgSAflGjXj7KlwFm4o7glpza3Q5EWV_CIas05s6WRXcth5O8Qjq8Z0s6iRLghEmTA_UW_QaTFiidiYknipr48taEvLcroZg/s450/Screen+Shot+2017-11-22+at+8.19.33.png)
![[Image: A screenshot of Fog Convolver.]](https://blogger.googleusercontent.com/img/b/R29vZ2xl/AVvXsEix0nl71C6FiN1Gal1S3F8aETwyyR4KlLG3AmKv9ULa2XqbK63uBWSvNlYSxeGoCyRPfN4Es_9MEw3qNCEdMr8RxEHuSwZfqqjrf_L4Tt8cQYMPm46JzLeScF3klY3U0ssLoKgiArTfrbia/s450/screenshot-fogbank.jpg)
![[Image: Close-up shot of a miniature vinyl record, with a detail view of the grooves.]](https://blogger.googleusercontent.com/img/b/R29vZ2xl/AVvXsEgt3gSLou9vVgUvBmkE3ED4wax1cru1J1s0FR8z1w2v59j3HqKD-l6MXafFwLk8SUS34_D5YkpPuGEDBv_4HgPwAlsrH_5dVNCqppDjuyYPS5lvUlMv72WIyiRfU4w6auJxqNW0wDCl-xVB/s350/vinyyli-zoom.jpg)
![[Image: The photo of the circular record unwrapped into a long linear strip.]](https://blogger.googleusercontent.com/img/b/R29vZ2xl/AVvXsEgEcWYze6gwl_Adheon9elKRD6fon9GdyWpGg_LoCzE8UtkpPVtzcfOVNNB5EWT91ZjCl5l8mDfiUeYGuVOWDYCa5k6KxHmmgDLdQmJIOHCiWBGKlJQSv9-i7dVhL3ttktCXo2-zccBkkr5/s520/unwrapped.png)
![[Image: A zoomed-in view of the unwrapped grooves labeled and highlighted with colored lines.]](https://blogger.googleusercontent.com/img/b/R29vZ2xl/AVvXsEgrCXDEnEGkileTPi_q5Zd8GVmEr4cxNPZBYj2zm4PXfMw4MP7v_HeI0Z024NxWeSfvObC3TXZJNFBig3xqHrB2luaHAFm-9RwYibcEacWEwfeqlFlmQJd1mMgP7EulMwK-oqbVAaQ62tmh/s420/raidat-manuaalisesti.png)
![[Image: Parts of a few grooves shown greatly magnified. They appear either as horizontal stripes, or horizontally organized groups of distinct blobs.]](https://blogger.googleusercontent.com/img/b/R29vZ2xl/AVvXsEi7BPvUXTmKHG6U_RrgeUoaXAKahZ67hbjVsTxb7MbfyvxA1AAf-swR0fSdSKx_PnWjHSKoXDYrf3lQiiATcOkx8tlmEBg0bhn_lQc3Bs2TBm3FNaA9aJ3MjQxNeLTh_lEDaPNh_wWRn78B/s380/groove-center-displacement.png)
![[Image: Information display onboard a Helsinki train, showing a transcript of an announcement along with the time of the day, current speed and other info.]](https://blogger.googleusercontent.com/img/b/R29vZ2xl/AVvXsEh26Tjh5ugfGUsyQTOimb0w9ppvdoNxwEWdQhP4WtSHEYTQ1f8RDCfAonikNw3n5pvlfB4JLvMg1Dpq35hJ0MMCOJi_EToLZ1fm85yRaXNZLaWSfkbTSaifvOGrmVVAgJ4HcX7NquaKy7NG/s200/Cv6TbdL.jpg)
![[Image: Byte histogram and Poincare plot of a raw audio file, characteristic of Gaussian-distributed data encoded as four-bit samples.]](https://blogger.googleusercontent.com/img/b/R29vZ2xl/AVvXsEh8Q8-T2Qr_Ecur96iJTFcsfPvxSnhl1fqfwWRf2i5jkOxNmQZEjkgjwz29e3xhHumDGS6oZBZ7esLlV1aXv7YdbIoDnIuwZATKyB0QsAO3YJLg4bD42BOZEJs_Ksj5-o4isE0MNQhN3NJf/s450/poincare-plots.png)
![[Image: A nondescript oscillogram of the data signal, and below it, the signal after FM demodulation, showing a clear pattern characteristic of binary FSK switching at 1200 bps.]](https://blogger.googleusercontent.com/img/b/R29vZ2xl/AVvXsEjC1scRJZ0uYjDdYjlDDwofVMz8mdVvL7_26-4MiRLn7ThCjaJJpH-2D-ylOpCSle4LYWyRNxs-XsCzhDEvoyr-biJwzSNk2KI3CdVvmNzT-PZ6zXXoqqUUPOl3R1CloThn5Ef0lVrs5H8B/s500/bitteja.png)
![[Image: A time-stamped hex dump of the byte stream, arranged in packets with only a few bytes changing over time.]](https://blogger.googleusercontent.com/img/b/R29vZ2xl/AVvXsEilaBnLuqt1a9yt_RZi-XACd-HKohNk4w0hAsH0ntktYkf2Icd1iPRNJOh4jeyig2G6yD-CU9JhYfKpG0rbAzMadFS9EBsUJRBEv5FUEmcWqM5rItCHMi9Jm1uFHQoGDdI-XEr0ELK2Cssc/s460/kopteri-bitit2.png)
![[Image: Screenshot from Google Earth, showing time-stamped placemarks tracing the roads of a suburb, accompanied by an X-Y plot of the changing FSK bytes that draws a very similar picture.]](https://blogger.googleusercontent.com/img/b/R29vZ2xl/AVvXsEi658ISVvXlb7DelH0uhyphenhyphen3tOFZu7xceBh2iE7mRjmuqbyFY44goZi-ZEu3fABnneGjEZQQrdRXO6-HN5-Mf0AVOnU2pVUqp4R1nM_5ZtLFijeuJBTAjIwgT13TaCIroWbnDUT1vaDyx-s8f/s460/positionplot.jpg)
![[Image: Coordinates from the whole data signal plotted on top of a Google Earth satellite photo several miles across, with a lot of circling around.]](https://blogger.googleusercontent.com/img/b/R29vZ2xl/AVvXsEjpo3zNOcWxPRGYQKVhPj5VseA9IIckX9g5y2NUcMqOB78Tme3U25qi0hg2ytxfo0grX5EPni35nn0XcfpSfWcCunBF8INr3jU_61b8bNCveDHAfn8iuIofHO_NX9nVgjOaBOzfqh8EGwkJ/s460/choptrace.jpg)
![[Image: Photo of a liquid crystal display showing the text: 8589 IBUS 6.5.70d]](https://blogger.googleusercontent.com/img/b/R29vZ2xl/AVvXsEjIxM06NvCn-6lRmadmoMFcAWaqAavrEczgpsNUyaTOdyggRTKBZ02VA3WlsjrbEZCpeF0mv41i8SWRCeDbVTrmtpXB_bkhKf-u6MVRgvm2YlN0m2Q1gOGzvMpiNDLFEypPVXpops-wZwdd/s400/IMG_0541a.jpg)
![[Image: An infographic titled 'Bus & Destination Packet', showing the hex bytes of a 64-byte packet, divided into fields that are labeled according to their apparent purpose. There are counters, size fields, the bus stop identifier, bus line identifiers, and apparent references to other types of packets. Several fields containing Latin-1 text are also transcribed. The text in them reads '23N RUSKEASUO BRUNAKÄRR'.]](https://blogger.googleusercontent.com/img/b/R29vZ2xl/AVvXsEjCvBNi49Nq5EFwmA6gAkOYbH07bMg5E6msCtUvwxmilZ-tj-sSZS6n8Wu8x2QUO0Iy2JY4JxUJaNuKHUuJGAMilZjjKaTxVdUbLiSzwMpYLDwx4rgbUIG6V-IsSZlGXEMmZeaTmLMBlLfp/s540/bus_dest_packet.png)
![[Image: An infographic titled 'Minutes Packet', showing another type of labeled packet. Most fields are one byte long and they contain the number of minutes until the next bus arrives, in 7 bits, and one bit telling whether this estimate is based on positioning or time tables. Information about which number belongs to which bus is contained in the references from other types of packets.]](https://blogger.googleusercontent.com/img/b/R29vZ2xl/AVvXsEjBvGn07zM_WjPnJ3xMxBC5nqWxFzzazr7EZ_4WJUtUyEUTBAej0QaWDrZBTnav9z_IEfim9Agvfqu2C9TJGztJogAVRYDJBEJRpU22Fb-1ILjJTIaRzzFlpNQ8j9jnwRaxiKttXRljdm0L/s540/bus_min_packet.png)
![[Image: Photo of a small liquid crystal display kit with its PCB showing, obviously home-soldered to a bunch of wires, and displaying the text: '72 TAPANILA ~12'.]](https://blogger.googleusercontent.com/img/b/R29vZ2xl/AVvXsEg3pZBIJ8IT_tPSlezjPW8g1z8DDJGNqexgODiPD4ZOeXUNMQ1AhRFyPuXFTzAOj8rFdq98Ks3MyOZ6gwrx8MdfDnXTJy8iokN2csJIJmCcOJ0I0kqX1Yw7yRyIMd1XreSoVAgwxEIS6jpW/s400/FScOI7G.jpg)
![[Image: A spectrogram showing a signal at the audible frequency range, labeled 'mono', and four carriers centered at 19, 38, 57, and 76 kHz, labeled pilot, 2f, 3f, and 4f, respectively. Pilot is a pure sinusoid; 2f and 3f are several kHz wide signals with mirrored sidebands; and 4f is 20 kHz wide and resembles wideband noise.]](https://blogger.googleusercontent.com/img/b/R29vZ2xl/AVvXsEi59H46xOh66oRU-x29wkkCwEQ-6if2ELMxo-a2ofHBE6Z1_kZRU4iYGDUD1j9435-Y00GZKsFZI6XhgBl8DG4i_sSjLVXh0s5FCfi8Ob2cM6y8AiajWeSI7tPbfm7Nqm_ltro3nZliKm7E/s540/darc.png)
![[Image: Three oscillograms followed by a stream of 1s and 0s. The first oscillogram is quite nondescript; the second one actually shows two waveforms, red and blue, in the same graph, with the red dominating in envelope power where blue is suppressed and vice versa. The third oscillograms shows a graph apparently following their envelope power difference, with sample points at regular intervals. The sign of this plot at sample points dictates whether a 0 or 1 is shown below that sample.]](https://blogger.googleusercontent.com/img/b/R29vZ2xl/AVvXsEi57Su6_LISIEe_8jUatXSGTZvtYa_9cb7yKvTzGwso8ymHmzwhgIPD4wkf8cwfFeP14mnS3H7ExkwoWf-0wUsMqxgtJAqGxbuhUUYgiUvL3k992I_JdW63tM31ONXk0kUlva3_kC_58xlc/s540/DARCb.png)
![[Image: Photo of a rugged LCD display mounted on a metal pole, displaying the text '55K FORSBY ~6' and stamped with the logo 'HSL HRT'.]](https://blogger.googleusercontent.com/img/b/R29vZ2xl/AVvXsEhPqX6IrlRSG8OliEhfo6AW4ma7KL3jNu6GKt5JbDbHTGWhw6v9taZwWj4-HWXwdW69y3aUXnDArh668ChdtU52o4mSEjEUPzwVoVYJonPyIb-nGahkE9plqtnvA45Aa3PF3Cm6y-y5XJCx/s400/IMG_6102.jpg)
![[Image: Photo of a very small radio hotglued inside a Hello Kitty branded tin.]](https://blogger.googleusercontent.com/img/b/R29vZ2xl/AVvXsEgN7plvn8aUJuzM0mFtcvg0bdkeNaolna8ZErsv1ZDNbvknRt7jB1WmNLrQEM-rUkvsa0WGb3XHqKIzmmMw1XaV6ocZ8ojyW0KDaE0PVnxI5pdDgjBy8tOkCpItg9LthnUHm4OaNYWPBIgn/s320/kitty.jpg)
![[Image: A cipher diagram beginning with the 16-bit hex words C1A0 and F3D5, labeled 'location' and 'key', respectively. The 'location' word goes into a bitwise right rotation block, controlled by the first nybble of 'key'. The third and fourth nybble of 'key', taken as a single byte, go to a bitwise left shift block controlled by the second nybble of 'key'. Outputs from these two bitwise blocks are XORed. The result is the hex word 85E9, labeled 'encrypted location'.]](https://blogger.googleusercontent.com/img/b/R29vZ2xl/AVvXsEg526X5zUY0KG9EDFojAVok_8ZTGPZy6OVhhaAMGnp1DVoI6BW3te9m3Wx3YznCEvlj7I7WWOntLAEXw2hfObtK0jqV__avyFcy648_MBlfmK68VCVQBEGvJ33tvKuf76sTIStAGDm0gE8f/s240/rdstmc.png)
![[Image: A pink, heart-shaped Post-It note with a hand-written columnar XOR calculation in binary. One of the operands is shifted left from the alignment. The result is 85E9.]](https://blogger.googleusercontent.com/img/b/R29vZ2xl/AVvXsEhJGrUAjCtScScKP1PvQTSIdaHAgqOLXkOLgCwaCLV2OADGoQD2HUdWd8At0Uzf56ox4jJ0YscKaiVGPbW_DeEdM7lbYxH43prWMIa-AQ-T45YtdWHCWsDf_Y1CVCb4gix8YEQGnshaW1LO/s300/IMG_3512p.jpg)
![[Image: Screenshot of a GUI with the title 'RDS-TMC'. It's divided into three sections. The first one, labeled 'TMC Service', tells that the service provider is 'MMN TMC+', we're using location table 6/17, and the data is encrypted with key number 5. The second section, labeled 'Received messages', shows a scrollable columnar list of traffic messages received, with a one-word description, an icon and rough location. The third section, 'Message', shows the selected message in detail. A map displays the affected road segment. A long event description is printed in Finnish, along with the road name, exact coordinates, speed limit, time of expiration, and the last time the message was received.]](https://blogger.googleusercontent.com/img/b/R29vZ2xl/AVvXsEi2IJZkvEH0BkYoI5GfOyyyy18gzVLb4tJXVh7n-zryhHn9xRzo02fE1wXfTTDM5RdGcO-WBBY2aeadLdf9r8ey12NXiSt8vpbWMVC2WmqQr9PxGV7EE7XheZ5HQCcfarqumWtMNAqe3uuU/s480/Screenshot-1.png)
![[Image: On the left, a gray box with the Logitech logo, a button labeled 'CONNECT', and a wire coming out of it, ending in two PS/2 connectors. On the right, the box opened and its PCB revealed. On the PCB there are three metal-colored crystals (16.4200 0014TC, 10.1700 0011TC3, 10.2700 HELE), two bulky components labeled LT455EW, and three microchips with Motorola logos. An array of wires goes out.]](https://blogger.googleusercontent.com/img/b/R29vZ2xl/AVvXsEgSTREus0n_1LDRexwA3tjjex6zgb0LmAucjsrw5AIbyIWLjqZXi-DV7zarICInttM6e7_vtyfVdfymAoqcl3ZZ-qg7mOhIYA_POAWLUUlyfGK_H977Wx7ciHn7tXpMBGlQYUbzN5PYJ7j9/s400/nappis-sisalmys.jpg)
![[Image: Spectrogram showing a constant sinusoid and, below it, a burst of data encoded in the frequency of another sinusoid.]](https://blogger.googleusercontent.com/img/b/R29vZ2xl/AVvXsEiOhTNwGz0wTPZJkXf1EmPtCuAzPZm5tGOPh5TG89bUSxWQRx4oK6D1MPHFTZZUmCJxtTvXzs2dkvOYwbEAAi1L_8yZcrUVQZ4-HhhUSczbHHo5Apg7kKJLj_xbaNl7EnrteT4izVsNtBL7/s1600/fmfsk.png)
![[Image: An oscillogram with 12 strong downward spikes of two distinctly different durations.]](https://blogger.googleusercontent.com/img/b/R29vZ2xl/AVvXsEieTtp9aKN2J3wjvD7Bw_PLLa8EF5k1PjnG5Tdx9C86kEea72AfTHqSNq2DFusub9VV91EsqSrWWvW3v0zhyphenhyphen-WTeAqq8k4AHYD7UQncuKuCpdByZ1lQ0r6Aq2_oEd7YvpOlr2VPlbQYCG59/s450/remote_unfilt.png)
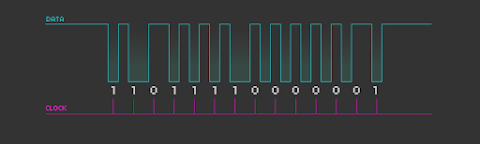
![[Image: Spikes from the above spectrogram superimposed with a regular clock signal and interpreted so that when a clock tick coincides with a spike, a logic one is produced, and when it coincides with zero, a logic zero is produced.]](https://blogger.googleusercontent.com/img/b/R29vZ2xl/AVvXsEip8fYVrZ4dPeqvB6kD_6NCDOteqMM9P80bID4vcodl9CwRcBp-VdvwRYqPfVkhmDVlZlllFFsd3bpekVZkK0kbmBYqCz2mct8MqicfI69lZsosnTBb04_54JPAYvQf1vFthw1f4dmgGOCk/s480/u5a.png)